Article Text

Abstract
Background The joint associations of total and intensity-specific physical activity with obesity in relation to all-cause mortality risk are unclear.
Methods We included 34 492 adults (72% women, median age 62.1 years, 2034 deaths during follow-up) in a harmonised meta-analysis of eight population-based prospective cohort studies with mean follow-up ranging from 6.0 to 14.5 years. Standard body mass index categories were cross-classified with sample tertiles of device-measured total, light-to-vigorous and moderate-to-vigorous physical activity and sedentary time. In five cohorts with waist circumference available, high and low waist circumference was combined with tertiles of moderate-to-vigorous physical activity.
Results There was an inverse dose–response relationship between higher levels of total and intensity-specific physical activity and mortality risk in those who were normal weight and overweight. In individuals with obesity, the inverse dose–response relationship was only observed for total physical activity. Similarly, lower levels of sedentary time were associated with lower mortality risk in normal weight and overweight individuals but there was no association between sedentary time and risk of mortality in those who were obese. Compared with the obese-low total physical activity reference, the HRs were 0.59 (95% CI 0.44 to 0.79) for normal weight-high total activity and 0.67 (95% CI 0.48 to 0.94) for obese-high total activity. In contrast, normal weight-low total physical activity was associated with a higher risk of mortality compared with the obese-low total physical activity reference (1.28; 95% CI 0.99 to 1.67).
Conclusions Higher levels of physical activity were associated with lower risk of mortality irrespective of weight status. Compared with obesity-low physical activity, there was no survival benefit of being normal weight if physical activity levels were low.
- exercise
- body mass index
- observational study
Data availability statement
Data ara available on reasonable request. The study-specific summary data included in the meta-analyses can be obtained from the corresponding authors; jtarp@clin.au.dk.
This is an open access article distributed in accordance with the Creative Commons Attribution Non Commercial (CC BY-NC 4.0) license, which permits others to distribute, remix, adapt, build upon this work non-commercially, and license their derivative works on different terms, provided the original work is properly cited, appropriate credit is given, any changes made indicated, and the use is non-commercial. See: http://creativecommons.org/licenses/by-nc/4.0/.
Statistics from Altmetric.com
Introduction
Low levels of physical activity and high prevalence of obesity are major public health challenges worldwide.1 2 Physical activity and weight status are connected entities through long-term energy balance. However, increased physical activity does not always lead to weight loss.3 4 Physical activity affects multiple metabolic pathways, such as glucose and lipid metabolism, and these pathways are considered strong mediators of adiposity-related morbidity.5 Thus, there is a strong biological plausibility that physical activity may counteract the detrimental consequences of obesity on longevity. Maintaining a healthy body weight, typically defined as a body mass index (BMI) between 18.5 and 25 kg/m2, is considered a cornerstone in chronic disease prevention.6 However, the shape and magnitude of the dose–response association between BMI and risk of premature mortality is debated.7 8 Hence, to improve clinical counselling and public health messages, there is a need to understand the joint contributions of adiposity and other health behaviours, such as physical activity, in relation to mortality risk.
High levels of self-reported physical activity appear to attenuate, but not eliminate, the excess risk of mortality associated with obesity.9–11 However, studies based on self-reported activity are prone to cognitive biases, often focus on leisure-time physical activity only and are unable to capture sporadic and light-intensity physical activity (LPA) that can be difficult to recall. In contrast, device-based measures of physical activity can capture the total volume of activity performed throughout the day as well as the full spectrum of physical activity intensity including sedentary time.
Using data from an international collaboration with device-measured and harmonised physical activity data, we examined the combined associations of total and intensity-specific physical activity and sedentary time with BMI in relation to risk of all-cause mortality. We also examined combined associations of moderate-to-vigorous physical activity (MVPA) and waist circumference with mortality risk in a subset where these data were available.
Methods
Studies
We have previously described how nine cohorts were identified from a systematic review and through personal contacts.12–14 Study selection, data extraction and bias assessment have also been described in detail.12 For this study, we excluded one cohort restricted to individuals at high risk of type 2 diabetes because of the potential bias introduced by conditioning on a disease associated with both physical activity and BMI.15 Thus, data from the eight remaining cohorts from the USA, UK, Norway and Sweden were included in this pooled analysis.14 16–22 Since our previous work,13 we have acquired additional mortality follow-up from the Women’s Health Study (mean follow-up time: 6.3 years), the Framingham Heart Study (mean: 7.0 years), the REasons for Geographic And Racial Differences in Stroke (REGARDS, mean: 7.8 years) and the European Prospective Investigation into Cancer and Nutrition-Norfolk (mean: 6.7 years).
Harmonisation of physical activity data
Six studies used a version of the ActiGraph accelerometer14 17–20 22 and two used an Actical accelerometer.16 21 Individual participant accelerometer data were reprocessed according to a standardised protocol by the participating study teams. We extracted data from only the vertical axis in 60 s epochs for harmonisation purposes. Non-wear time was defined as ≥90 consecutive minutes of zero counts, allowing for up to 2 min of non-zero counts if the interruption was preceded or followed by ≥30 min of zero counts.23 We included all participants who recorded at least 10 hours of wear time per day for four or more days. Total physical activity was defined by total counts per day/wear time per day in minutes (counts per minute (CPM)). ActiGraph monitors defined LPA as 101–1951 CPM and MVPA as ≥1952 CPM.24 Actical monitors defined LPA as 101–1534 CPM and MVPA as ≥1535 CPM.25 The sedentary time count threshold was 100 CPM for both monitors.26 27
Combinations of physical activity and weight status
We created tertiles of low, medium and high total physical activity, LPA, MVPA and sedentary time separately for each cohort and reported tertile medians for each cohort in online supplemental eTable 2. We combined these tertiles with the standard BMI categories (normal weight: 18.5–25, overweight: 25–30, obesity: ≥30 kg/m2), yielding nine physical activity–BMI combinations for each physical activity exposure. LPA, MVPA and sedentary time were normalised by wear time (per cent of wear time) before creating the tertiles. BMI was based on height and weight measured by trained staff in five cohorts14 18 20 21 28 and self-reported in three cohorts.17 19 22 We had access to measured waist circumference as a measure of central obesity, defined as waist circumference ≥88 cm for women and ≥102 cm for men, in five cohorts.14 18 20 21 28 These two categories were combined with tertiles of MVPA yielding six combinations of physical activity and waist circumference.
Supplemental material
Analysis
All cohorts restricted analysis to participants >40 years of age as in our earlier work.12 For this study, we excluded participants with less than 2 years of follow-up, a BMI less than 18.5 kg/m2 or a history of cardiovascular disease (CVD) or cancer at the time of accelerometer assessment to minimise bias from reverse causation. In the REGARDS cohort, we were only able to exclude individuals with prevalent CVD because information on prevalent cancers was not collected in the full cohort. For each cohort, we used Cox proportional hazards regression models to estimate the HRs with 95% CIs of all-cause mortality for the participants in eight combinations of BMI and physical activity, compared with the reference category (least active participants with obesity; ie, bottom third for physical activity or top third for sedentary time). Five HRs were estimated for waist circumference. The cohort-specific analyses were harmonised according to various levels of adjustment. Our main model adjusted for age, sex (when applicable), socioeconomic status, smoking and the covariates included in each cohort’s published final multivariable-adjusted model (see online supplemental eTable 1 for details). Additionally, models with MVPA as the exposure were adjusted for sedentary time (continuous form), and models with LPA and sedentary time as exposure were adjusted for MVPA (continuous). We meta-analysed cohort-level HR estimates with a DerSimonian and Laird random effects model yielding eight pooled HRs with 95% CIs (five for waist circumference). When no cases were observed for a given combination of physical activity and BMI in a single cohort (eg, among never smokers in the cohorts including fewest participants), this cohort was not included in the meta-analysis of that particular combination (eg, obese with high physical activity) but was included in meta-analyses of the other combinations. The sample weights and the complex survey design of the National Health and Nutrition Examination Study (NHANES) were accounted for prior to analyses.20
Sensitivity analysis
We performed a sensitivity analysis among never smokers because multivariable adjustment for smoking status is unlikely to fully capture confounding from smoking behaviours on the BMI–mortality association.7 As smoking is strongly associated with morbidity this restriction may also reduce the risk of reverse causation bias from subclinical disease leading to low physical activity.29 Furthermore, we also present analyses including participants reporting prevalent CVD or cancer at baseline, but with adjustment for these conditions in the statistical model.8 29–31 Finally, we repeated the analysis only including the five cohorts with measured BMI and after exclusion of the REGARDS cohort that did not have information on prevalent cancers.
Results
We included 34 492 participants (72% women; median age across cohorts: 62.1 years). These were followed for 6.0–14.5 years (median 7.4 years), during which 2034 died (5.9%). Table 1 presents the participant characteristics for each cohort with physical activity and sedentary time exposure levels in online supplemental eTable 2. Across cohorts, the prevalence of obesity ranged from 10.0% to 33.7% (median 19.4%). We present independent, multivariable-adjusted associations between physical activity, sedentary time and BMI categories with mortality risk in table 2. Total physical activity showed the strongest magnitude of an inverse association with mortality, and this association was largely unaffected by restriction to never smokers. There was no association between high sedentary time and mortality risk when restricting the analysis to never smokers. Compared with being normal weight, overweight was associated with a lower mortality while the association was attenuated for obesity. Restricting to never smokers inverted the association for obesity although the CIs still overlapped the line of unity.
Descriptive characteristics of included cohorts
Independent associations between physical activity, sedentary time and BMI with all-cause mortality
Joint associations of physical activity, sedentary time and adiposity with mortality
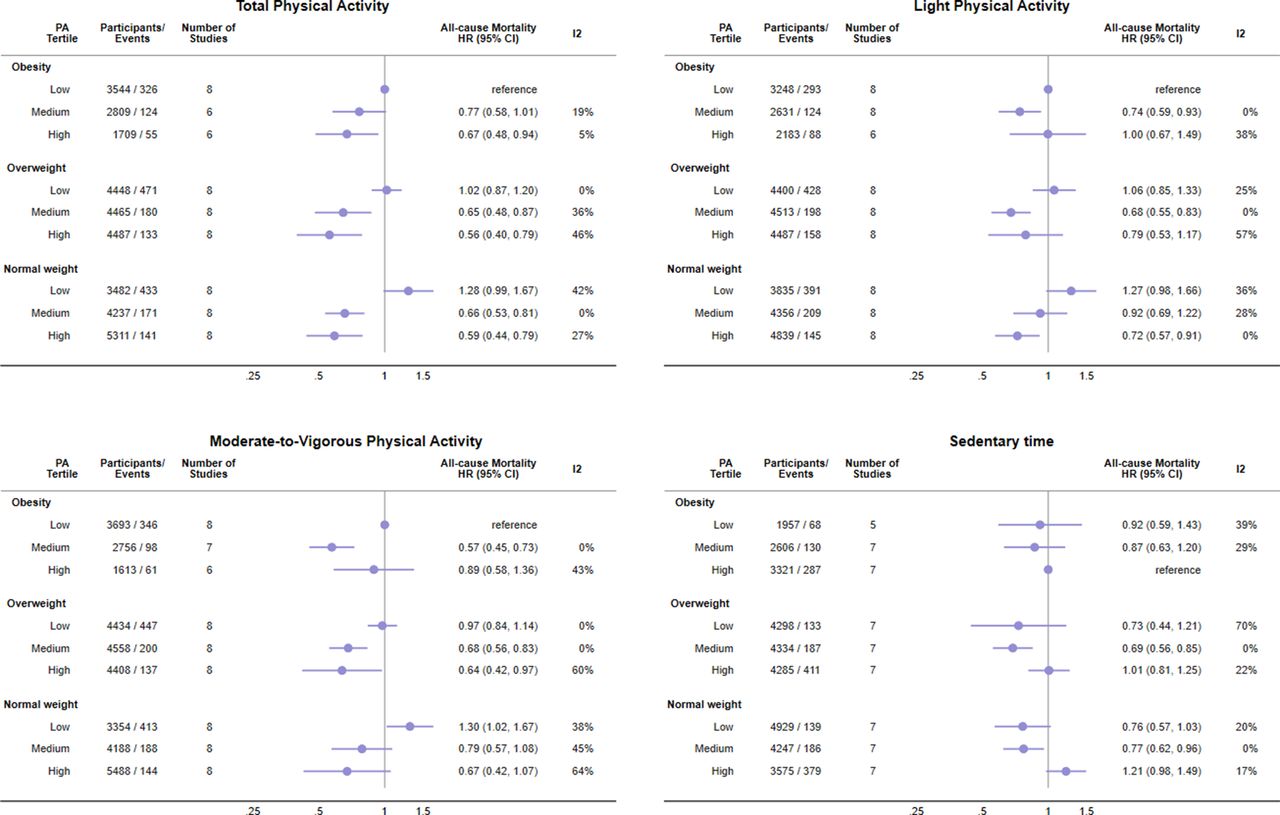
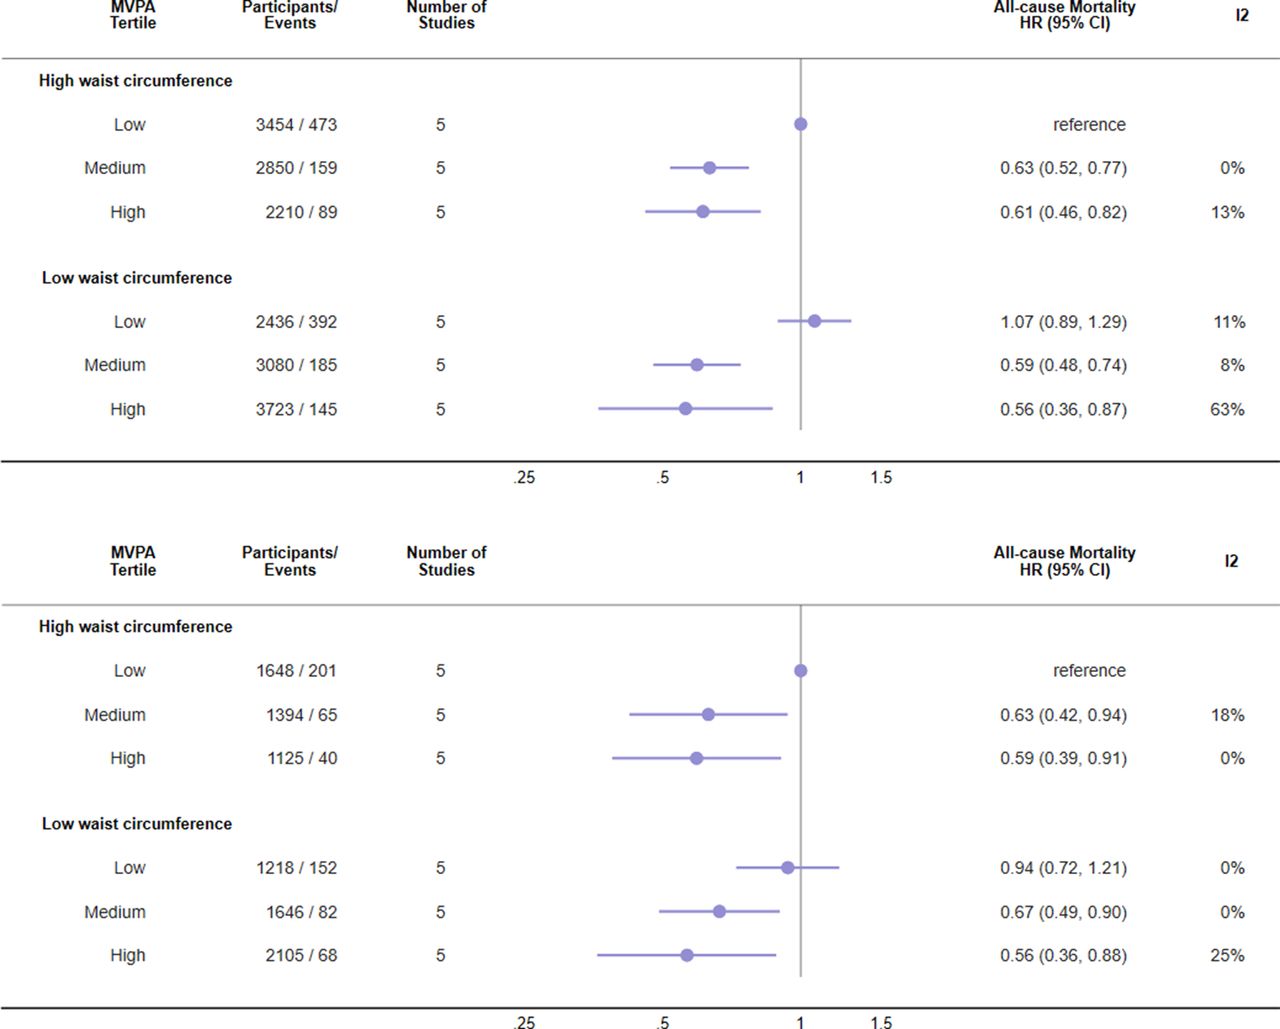
Higher total physical activity, LPA and MVPA were associated with lower risk of mortality in all BMI categories (figure 1). The pattern of associations was roughly similar across physical activity variables, but with more consistent dose–response patterns and stronger effect sizes for total physical activity. The effect sizes for high total physical activity versus obesity-low activity were similar across BMI categories: 0.59 (95% CI 0.44 to 0.79), 0.56 (95% CI 0.40 to 0.79) and 0.67 (95% CI 0.48 to 0.94) for normal weight, overweight and obesity, respectively. In contrast, in individuals with obesity, high LPA was not associated with lower mortality (1.00, 95% CI 0.67 to 1.49) and the strength of the association for MVPA was weaker than observed in the normal weight and overweight categories. However, when BMI was replaced with waist circumference combined with MVPA, similar inverse associations of high MVPA were observed in those with low (0.56, 95% CI 0.36 to 0.97) and high (0.61, 95% CI 0.46 to 0.82) central adiposity (figure 2). Less time spent sedentary appeared to be associated with lower mortality in the normal weight and overweight categories, but sedentary time was not associated with mortality risk in the obese category (figure 1).

Joint associations of physical activity or sedentary time and body mass index (BMI) with risk of all-cause mortality. n=34 492, deaths=2034. Individuals self-reporting prevalent cardiovascular disease (CVD) or cancer are excluded. Analysis of sedentary time includes n=33 552; 1920 deaths as there were no cases in the reference category in the British Regional Heart Study. Models are adjusted for age, sex (when applicable), socioeconomic status, smoking and the covariates included in each study’s published final multivariable-adjusted model (see online supplemental eTable 1 for details). Additionally, models using moderate-to-vigorous physical activity were adjusted for sedentary time (continuous form) with sedentary time and light physical activity adjusted for moderate-to-vigorous physical activity (continuous). Median activity and sedentary time in exposure categories are shown in online supplemental eTable 2. PA, physical activity.

Joint associations of moderate-to-vigorous physical activity (MVPA) and waist circumference with risk of all-cause mortality. Top panel: excluding individuals with self-reporting prevalent cardiovascular disease (CVD) or cancer (n=17 773; 1443 deaths). Bottom panel: as top panel but further restricted to never smokers (n=9136; 608 deaths). Both models are adjusted for age, sex (when applicable), socioeconomic status, smoking (top panel only), sedentary time (continuous) and the covariates included in each study’s published final multivariable-adjusted model (see online supplemental eTable 1 for details).
Supplementary and sensitivity analyses
Sensitivity analysis restricting to never smokers removed the higher mortality risk among the normal weight-low active group but did not otherwise change interpretation of the results (figure 3). Results without adjustment for other physical activity behaviours are shown in online supplemental eFigure 1. Sensitivity analyses excluding the REGARDS cohort and restricting to cohorts with measured BMI suggested results were largely robust (online supplemental eFigures 2 and 3). In individuals with obesity, the effect size for high total activity was attenuated (HR 0.87, 95% CI 0.57 to 1.33) while the effect size for high MVPA was accentuated (HR 0.69, 95% CI 0.50 to 0.95). Analysis including individuals with prevalent CVD or cancer, but with adjustment for these variables, showed a similar pattern as the main analysis, but with slightly stronger effect sizes (online supplemental eFigure 4), with descriptive characteristics for these participants in online supplemental eTable 3.

Joint associations of physical activity or sedentary time and body mass index (BMI) with risk of all-cause mortality in never smokers. n=17 485, deaths=864. Analysis of sedentary time includes n=17 072; 820 deaths as there were no cases in the reference category in the British Regional Heart Study. Individuals self-reporting prevalent cardiovascular disease (CVD) or cancer are excluded. Models are adjusted for age, sex (when applicable), socioeconomic status and the covariates included in each study’s published final multivariable-adjusted model (see online supplemental eTable 1 for details). Additionally, models using moderate-to-vigorous physical activity were adjusted for sedentary time (continuous form) with sedentary time and light physical activity adjusted for moderate-to-vigorous physical activity (continuous). PA, physical activity.
Discussion
In this harmonised meta-analysis of almost 35 000 participants with device-measured physical activity, we observed an inverse dose–response relationship between higher levels of total and intensity-specific physical activity and mortality within the normal weight (BMI 18.5–25) and overweight categories (BMI 25–30). An inverse dose–response relationship within the obese category (BMI >30) was only observed for total physical activity. However, the inverse association between MVPA and mortality risk was similar in low and high waist circumference categories, suggesting a role of MVPA in determining central adiposity-related mortality. Low sedentary time was associated with lower mortality risk in those with normal weight and overweight, but not in individuals with obesity. A consistent finding was that being normal weight did not provide any survival benefits in those with low physical activity or high sedentary time, compared with the obese-low active (or high sedentary time) referent. These results support the main 2020 WHO physical activity and sedentary behaviour recommendations that all adults should undertake regular physical activity and ‘every move counts’.32
A dose–response relationship between MVPA and risk of premature mortality within the normal weight and overweight categories largely corroborates earlier studies based on self-reported activity.9–11 33 34 Some of these studies10 11 also reported dose–response relationships for physical activity among individuals with obesity, while some did not.9 34 While these stratified analyses provide useful insights into physical activity prescription in population subgroups (ie, does physical activity promote longevity in those with or without obesity), they do not address the possibility that risk of poor health outcomes may be shaped by the combined exposure to both obesity and physical activity. Nor do they provide insight on whether physical activity may in fact eliminate the higher mortality risk observed with obesity.7 Studies examining the joint association of self-reported physical activity and adiposity have generally reported that physical activity attenuated, but did not eliminate, the increased mortality risk among individuals with obesity.9–11 For example, in the Nurses’ Health Study, all-cause mortality risk was about 2.5 times higher among women with obesity with less than 1 hour of exercise per week that was attenuated to an HR of 1.9 among women reporting more than 3.5 hours of exercise per week, as compared with the healthy BMI-most active reference group.10 Similarly, in a recent study including about 300 000 individuals from the UK Biobank cohort, also using the healthy BMI-most active as the reference, the all-cause mortality HR among those with obesity type I (BMI 30–35) was 1.4 for the least active and 1.2 for the most active category.9 In this study, the most active third of total activity had an approximate 30%–40% lower risk compared with the obese-least active reference, irrespective of their BMI. Our findings are therefore in agreement with earlier studies based on self-reported MVPA, and we extend these observations by showing that device-measured physical activity, irrespective of intensity, may outweigh the risk of premature mortality from obesity. We show that an overall volume of physical activity comparable with the most active third of our samples was associated with a pronounced lower mortality risk among individuals with obesity, and that even reaching a physical activity level corresponding to the second tertile may provide the majority of the survival benefit. In the nationally representative US NHANES and the Norwegian National Physical Activity Survey cohorts, the difference in non-sedentary time (LPA +MVPA, assuming 16 hours of daily awake time) between the least active and the middle third of total physical activity was between 1 and 1.5 hours/day in all BMI categories. In comparison, the difference between the least active and the middle active third of MVPA was roughly 12 min/day in the NHANES and 20 min/day in the Norwegian National Physical Activity Survey. MVPA requires an intensity equivalent to at least brisk walking and may be achieved by active transportation, walking, exercise and heavy gardening activities. In contrast, examples of LPA include casual walking, household chores, yoga or tai chi, and pétanque. Thus, physical activity can be accumulated by combining LPA and MVPA differently to promote longevity.32
The dose–response pattern between higher BMI and mortality is not linear, but has a curvilinear slope at a BMI above 30 kg/m2.7 The cohorts included in our study were not large enough to permit a more granular assessment of the joint associations at higher levels of BMI which may explain why we did not observe increased mortality with obesity in our sample. Further, particularly the normal weight category may be susceptible to residual confounding from disease.29 This would also attenuate the obesity–mortality association compared with normal weight and thereby impact the joint association pattern. The higher mortality risk with normal weight-low activity provides some evidence in this direction. When we restricted our analysis to never smokers this higher mortality was no longer evident, but the rest of the association pattern was robust. Yet, inference from conservative analysis of observational data and Mendelian randomisation studies suggest that a BMI below 20 may be causally associated with higher mortality risk.7 35 We therefore suggest that further studies on this topic perform a detailed assessment at both high (eg, >35 km/m2) and low levels of BMI when possible. We included population-based cohorts three of which used using national sampling frames but our combined data set is selected towards women and older individuals. This could have introduced selection of individuals with healthy ageing and may impact the generalisability of the observed joint association pattern to younger adults as the obesity–mortality association weakens with advancing age.7 36
We extend previous work in this data set12 by showing the importance of the total volume of physical activity across standard categories of BMI. It is unclear why high LPA and MVPA among individuals with obesity were not associated with lower mortality risk when there was clear evidence of an association in the middle tertiles. This may reflect statistical uncertainty as individuals with obesity and high MVPA constituted the smallest proportion of the sample. Alternatively, misclassification of activity intensities could be more pronounced with obesity as the absolute accelerometer intensity thresholds do not account for individual variation in fitness. Further, the biomechanical properties of walking are affected by obesity37 which may also result in misclassification of LPA and MVPA. In contrast, total physical activity is cut-point invariant. A recent analysis of physical activity measured by wrist-worn accelerometry in almost 100 000 participants corroborates the importance of the total volume of activity for lowering mortality but also suggests additional benefits are accrued if the total volume is accumulated through higher intensity activity.38 Importantly, high waist circumference was not associated with higher mortality risk in those with medium or high MVPA. As centrally distributed fat is considered more detrimental than subcutaneous fat,39 engaging in MVPA may be particularly relevant for those with central obesity. The association between sedentary time and mortality differed from that reported in our earlier work.12 Possible explanations include the current use of tertiles instead of quartiles, or additional follow-up time in some of the included cohorts.31 40 Sedentary time was defined as absence of movement from waist-mounted or hip-mounted accelerometry and may also include time standing completely still.41 Standing may account for a large part of non-movement but would probably decrease with age and retirement from work.42 Hence, differences in participant demographics would influence the extent of misclassification in each cohort.
We highlight two implications of our findings for public health. First, physical activity should be promoted regardless of the weight status of individuals. Healthcare providers may be less inclined to discuss lifestyle factors such as physical activity and diet with individuals who have a healthy body weight.43–45 Our results and the work of others suggest substantial benefits may accrue if physical activity levels are increased in this population.9 10 34 46 Second, very few people with obesity succeed in achieving a sustained weight loss47 despite this being an integral part of primary care management of obesity.48 This is because body weight is determined by a complex relationship between multiple behavioural, environmental and genetic factors.49 Focusing communication on the positive benefits of regular physical activity in this population, such as improved mental health,32 improved physical functioning,32 decreased reliance on medications to control cardiometabolic risk markers45 and lower mortality risk, irrespective of any concurrent weight loss, may help send a more positive message.
Our findings should be interpreted in the light of several limitations. BMI is not a direct measure of body fat and may misclassify individuals with high lean mass into the overweight or obese categories. This bias could potentially inflate estimates of the benefits of higher activity in these categories. We used sample-specific tertiles to categorise physical activity variables. The largest mortality benefits are observed with small differences at the lower end of the activity spectrum,32 and these nuances may not be fully captured with tertiles. We excluded individuals with prevalent CVD or cancer as well as deaths within the first 2 years of follow-up to reduce the risk of prevalent or subclinical conditions being a cause of lower activity and/or adiposity which would bias our results. However, it is possible that this time frame is insufficient to fully remove this bias7 31 and we were not able to exclude individuals with prevalent cancer in the REGARDS cohort as these data were not collected. Our analysis is based on the constant exposure assumption as we were unable to account for changes in physical activity or BMI over time. Careful modelling of changes in exposure over time in relation to later health outcomes should be a priority in future studies.50 We included cohorts from high-income western countries with distinct physical activity patterns and a high prevalence of obesity which may limit generalisability of the results to low and middle-income countries. Finally, as a meta-analysis of observational studies, residual biases from selection, measurement error or confounding cannot be refuted.
In summary, higher physical activity was associated with lower risk of mortality irrespective of weight status. Compared with obesity-low physical activity, there was no survival benefit of being normal weight if physical activity levels were low. Clinicians, communities and public health specialists should promote physical activity for longevity irrespective of weight status.
What are the findings?
Higher device-measured physical activity was associated with a lower risk of mortality irrespective of weight status.
Compared with obesity, there were no survival benefits of having a normal weight if physical activity levels were low.
Lower levels of sedentary time were associated with lower mortality risk in normal weight and overweight individuals but there was no association between sedentary time and risk of mortality in those who were obese.
How might it impact on clinical practice in the future?
Physical activity should be promoted irrespective of an individual’s weight status.
Promoting even small increases in daily physical activity should be a cornerstone of obesity management, irrespective of any concomitant changes in body weight.
Data availability statement
Data ara available on reasonable request. The study-specific summary data included in the meta-analyses can be obtained from the corresponding authors; jtarp@clin.au.dk.
Ethics statements
Patient consent for publication
Ethics approval
Ethics approval was obtained by the original study groups. Ethical approval has been granted for all individual studies but was not required for this meta-analysis.
References
Supplementary materials
Supplementary Data
This web only file has been produced by the BMJ Publishing Group from an electronic file supplied by the author(s) and has not been edited for content.
Footnotes
Twitter @PARG3, @PC_Dempsey
Contributors JT, UE and MWF had full access to the cohort-specific data and take full responsibility for the integrity of the data and the accuracy of the meta-analyses. Study concept and design: JT, UE, MWF, I-ML. Acquisition of data: all authors. Analysis and interpretation of pooled data: JT, UE, KED, BHH, MWF, JSJ, SAA, I-ML. Drafting of the manuscript: JT, UE. Critical revision of the manuscript for important intellectual content: all authors. Statistical analysis of pooled data: MWF, JT. Statistical analysis of individual studies: JT, BJJ, PCD, AC, KMD, I-MD. Study supervision: UE. JT is the study guarantor.
Funding The ABC study was funded by the Stockholm County Council, the Swedish National Centre for Research in Sports and the project ALPHA, which received funding from the European Union in the framework of the Public Health Programme and Folksam Research Foundation, Sweden. The British Regional Heart Study was funded by project and programme grants from the British Heart Foundation (PG/13/86/30546, RG/13/16/30528). The EPIC-Norfolk study has received funding from the UK Medical Research Council (MR/N003284/1), Cancer Research UK (C864/A14136) and the NIHR Biomedical Research Centre in Cambridge (IS-BRC-1215-20014). PCD is supported by a National Health and Medical Research Council of Australia Research Fellowship (1142685), and PCD and KW by the UK Medical Research Council (MC_UU_12015/3, MC_UU_00006/4, MC_UU_12015/3). The Framingham Heart Study’s data collection and analysis was funded by the National Institutes of Health (NIH), the National Heart, Lung, and Blood Institute (NHLBI) (N01-HC25195, HHSN268201500001I, 75N92019D00031) and grant from the National Institute on Aging (R01AG047645), Health and Human Services (HHS) (N268201500001I, R01-AG047645, R01-HL131029) and the American Heart Association (15GPSGC24800006). The Norwegian National Physical Activity Surveillance Study was supported by the Norwegian Directorate for Public Health and the Norwegian School of Sport Sciences. JT is funded by the Research Council of Norway (249932/F20). The REGARDS study was supported by a cooperative agreement (U01-NS041588) cofunded by the National Institute of Neurological Disorders and Stroke and the National Institute on Aging of the NIH. Additional funding was provided by an investigator-initiated grant (R01-NS061846) from the National Institute of Neurological Disorders and Stroke of the NIH and an unrestricted research grant from the Coca-Cola. The Women’s Health Study was funded by the NIH grants (CA154647, CA047988, CA182913, HL043851, HL080467, HL099355). EJS was supported by the intramural research programme at the National Institute on Aging.
Competing interests None declared.
Provenance and peer review Not commissioned; externally peer reviewed.
Supplemental material This content has been supplied by the author(s). It has not been vetted by BMJ Publishing Group Limited (BMJ) and may not have been peer-reviewed. Any opinions or recommendations discussed are solely those of the author(s) and are not endorsed by BMJ. BMJ disclaims all liability and responsibility arising from any reliance placed on the content. Where the content includes any translated material, BMJ does not warrant the accuracy and reliability of the translations (including but not limited to local regulations, clinical guidelines, terminology, drug names and drug dosages), and is not responsible for any error and/or omissions arising from translation and adaptation or otherwise.